 South Yorkshire

South Yorkshire
| Use back button |
|
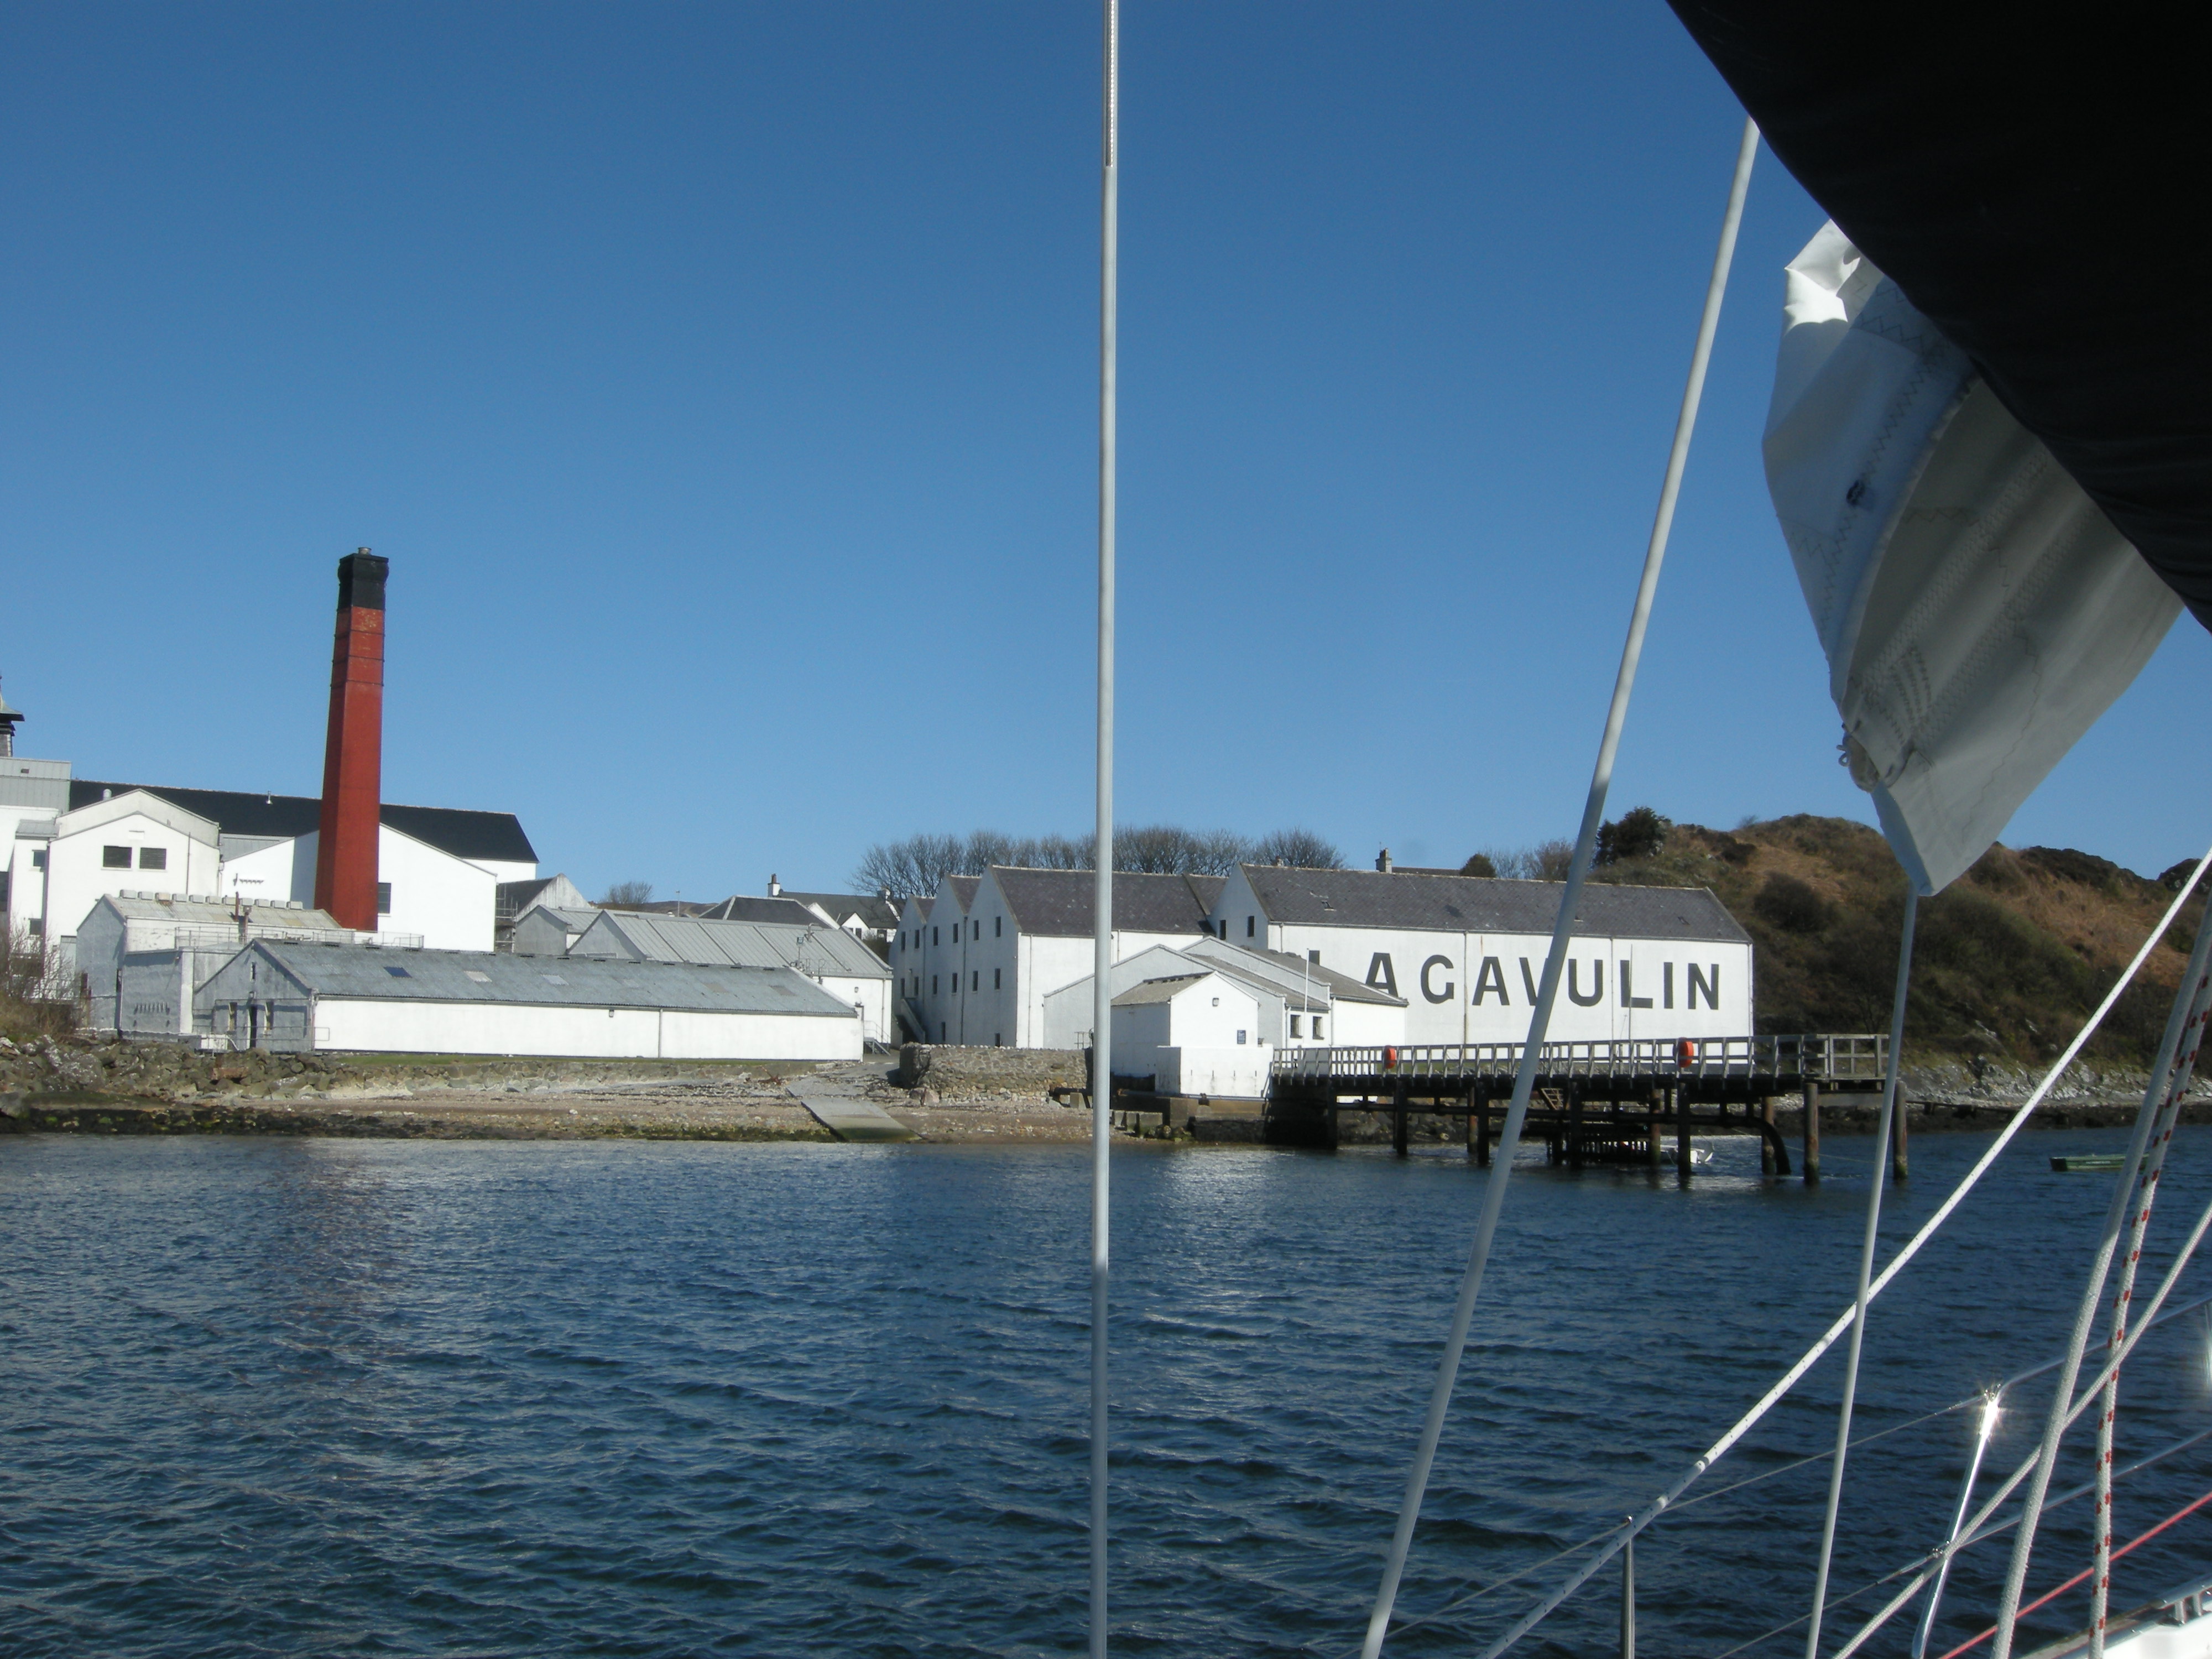
Secondary Port Tide Heights >> for example the Lagavulin whiskey distillery in Isla Being
able to accurately calculate tide heights in anchorages is
an essential useful skill. To anchor closer in and safe, to
feel safer overnight, or even to venture in at all. To do
this you must establish at what time of the tide it is when
you arrive, and by how much the level will fall to the next
(and subsequent) low waters, and rise to subsequent high
waters. Only then can you select a safe depth to anchor
using the sonar, and the scope of anchor to deploy.
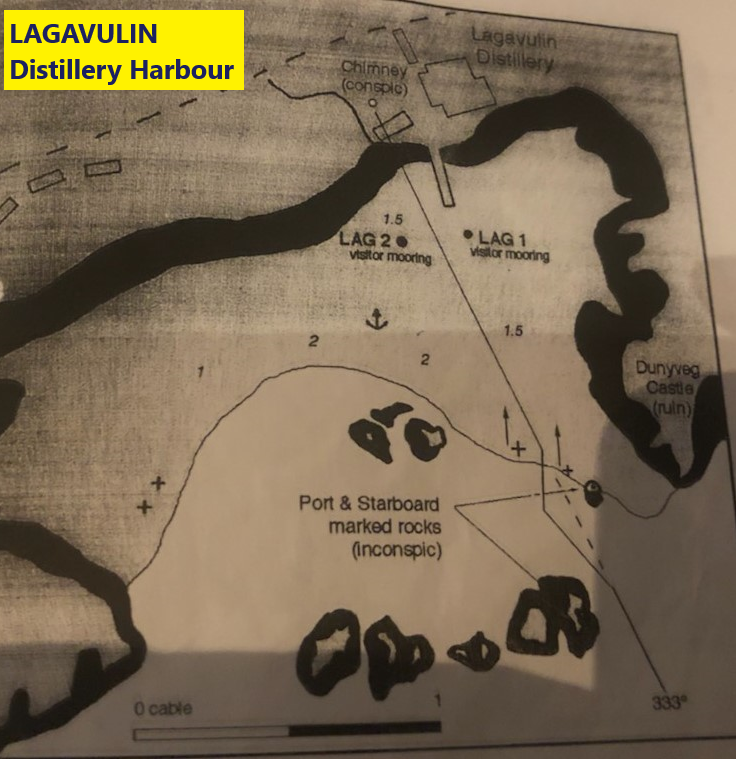
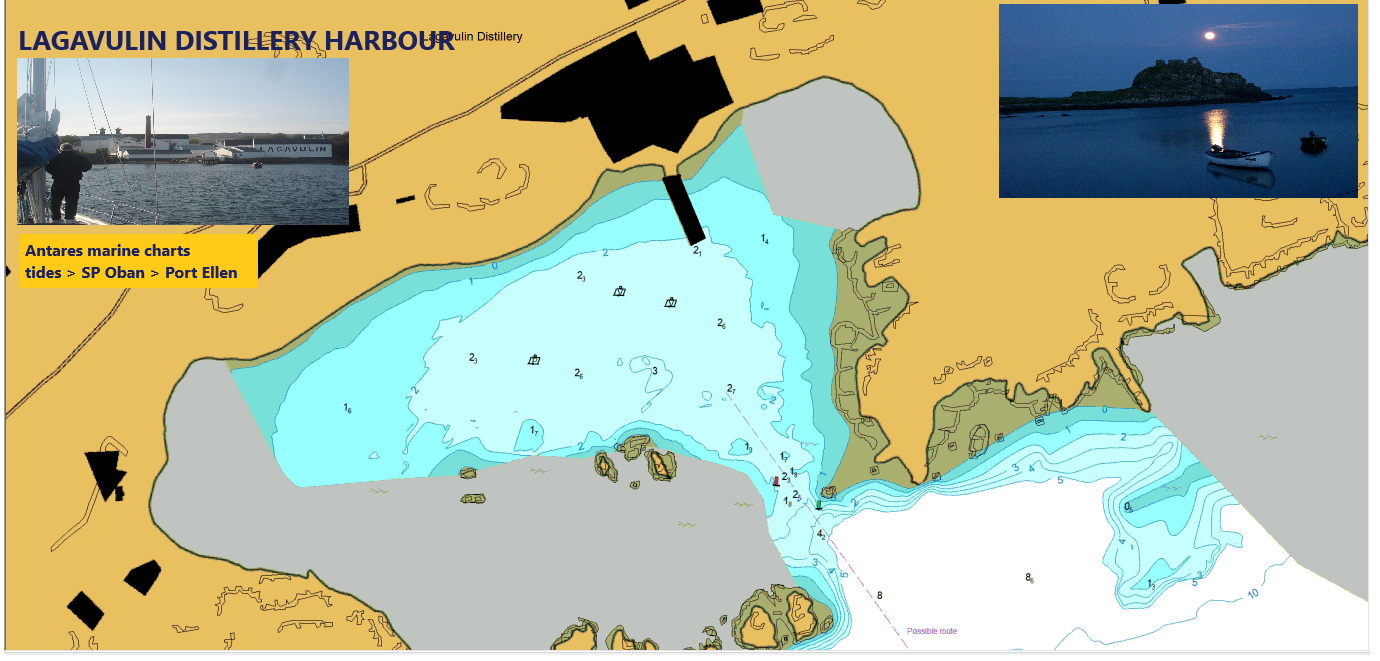
Up to date charting below, not available from the original pilot data chart above.
With a draught of around 1.8m it was
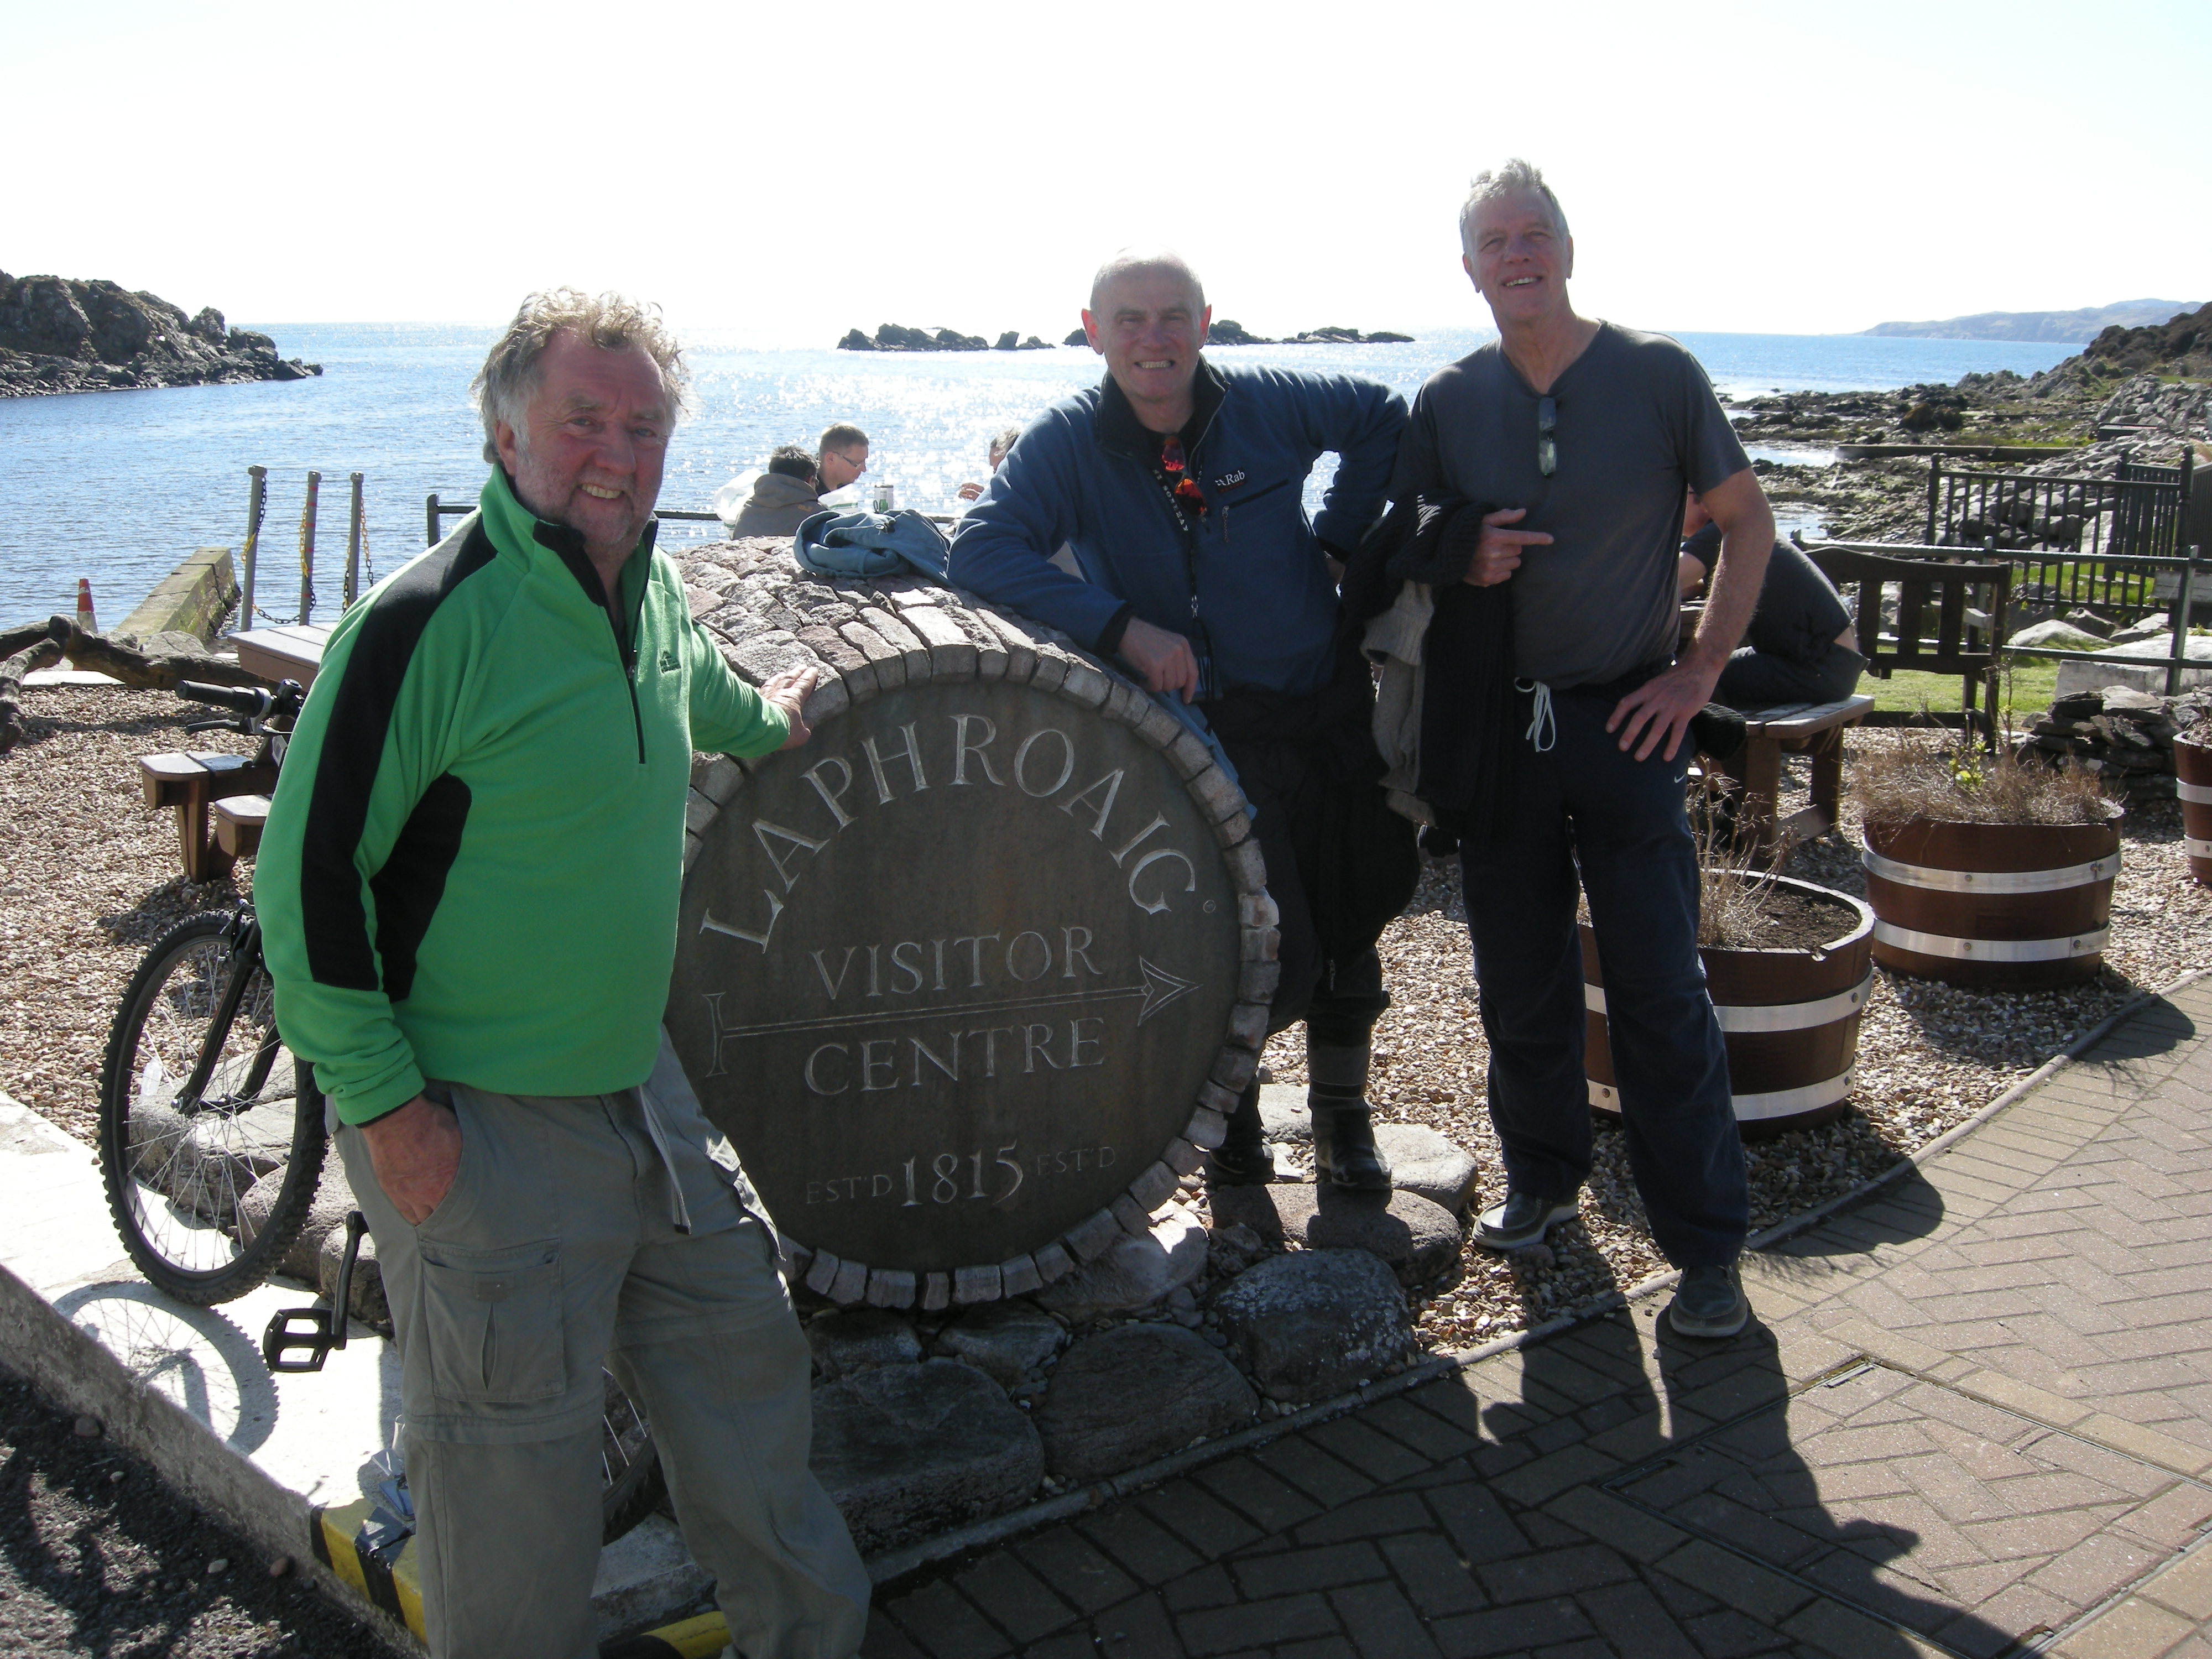
not clear if we would be safe here overnight, hence: Depth to Anchor (sonar reading) = Fall + Keel + Safety Margin Calculation is more challenging for small secondary locations and especially so where big deviations exist in comparison with 'its' Standard Port tide height data. The anchorage at the Lagavulin whiskey distillery in Isla, West Scotland is one such example we were keen to visit and stay. Doubly so because the Loafraig distillery is a 1mile walk along the road, see photos. On both occasions we have visited the tide range on the day was on, or outside of the mean spring range at the Standard Port (Oban) and on cursory examination of the Standard Port data, and the depth in the harbour on our arrival, at around high water time, we would have abandoned the quest. Spock was concerned we would ground overnight, but with other experts aboard a vote to stay was carried. We arrived at 17.40 BST, quite close to the time of high water at Oban (1752 UT, 4.2m) and with an overnight range of Oban 3.3m (which is the same as the mean range at springs). Since we were arriving around high water time (before correction), with a depth of only 2.8 below the water line in the anchoring area near the Lagavulin pier and with a keel of 1.8 meters the case might look hopeless. We would be high and dry in the middle of the night. However: Lagavulin does not have its own entry in the almanac, rather a small note confirms Port Ellen as its own secondary port reference, and whose standard port is Oban. Due to the large tide flows in the west of Scotland, the narrow gaps between Islands, in this case between Isla and Jura, both tide times and heights vary considerably between our secondary port (Port Ellen) and its standard port (Oban) data.
See below the shift data table for Port Ellen (Lagavulin) to Oban
SIMPLE
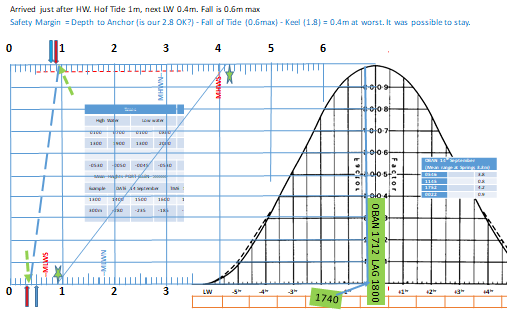
ESTIMATION Depth to anchor (sonar) = Fall of Tide (0.6max) + Keel (1.8) + Safety Margin or: Safety
Margin = Depth to Anchor (is our 2.8 OK?) - Fall of Tide
(0.6max) - Keel (1.8)
Simple Visual Method Observe
that: In this case of Port Ellen we can see right away that the range today is only marginally different from 0.6m (a bit to the right of both red bars). This fully
worked visual method for this Lagavulin instance is shown
below and is a quick and effective method. Similar triangles
and tabulations are not needed.
FULL CALCULATION USE THE TRIANGLE METHOD OR AS BELOW CORRECTED
TIME OF HW. Consider
the time of high water first and use the triangle method, or
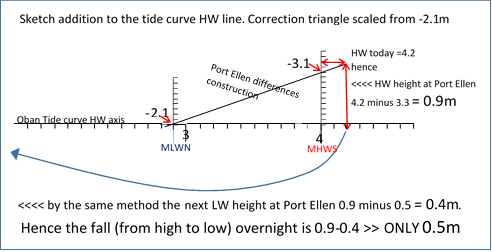
arithmetic interpolation if you like however in words: CORRECTED HW AND LW HEIGHTS. Now consider the Height of both the high water and the following low water to determine the fall overnight. The following sketch adaption I make to the tide curve diagram (of the standard port OBAN) in the almanac and is an ‘easier to do’ triangle interpolation method.
The fall to the next low is 0.5m (from high to low and since we arrived close in time to the HW we could use the total fall) our draught is 1.8m. The sonar depth from the water line on arrival is 2.8m.
Clearance at LW =
Depth (current) –
Fall (to next low) –
Draught
= 2.8 – 0.5 – 1.8
=0.5m Note because we arrived near to high water it was unnecessary to use the Oban tide curve shape (or twelfths rule to determine the fall as would be required if we had arrived mid-tide (though on the curve are marks the lines to work against).
|
|||||||||||||||||||||||||||||||||||||||||||||||||||||||||||||||||||||||||||||||||||||||||||||||||||||||||||||||